Passengers & Rides Tables
Both the passenger and rides tabs are managed through datatables, which resembles an Excel table. The passengers table includes all the passengers in the system and is required for creating a ride, while the rides table includes all the previous ride’s data. Each row displays the fields for a particular passenger or ride as well as the two action buttons (Edit or Delete).
Here are the features that exist on the Passengers & Rides tab:
Hide / Show Columns
The checkmarks reflect what fields are currently displayed, you can select and choose which ones are displayed to your liking.

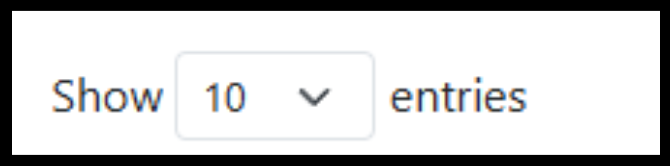
Show # of entries
You can select how many rows are displayed on one page, the default setting is 10 rows per page.
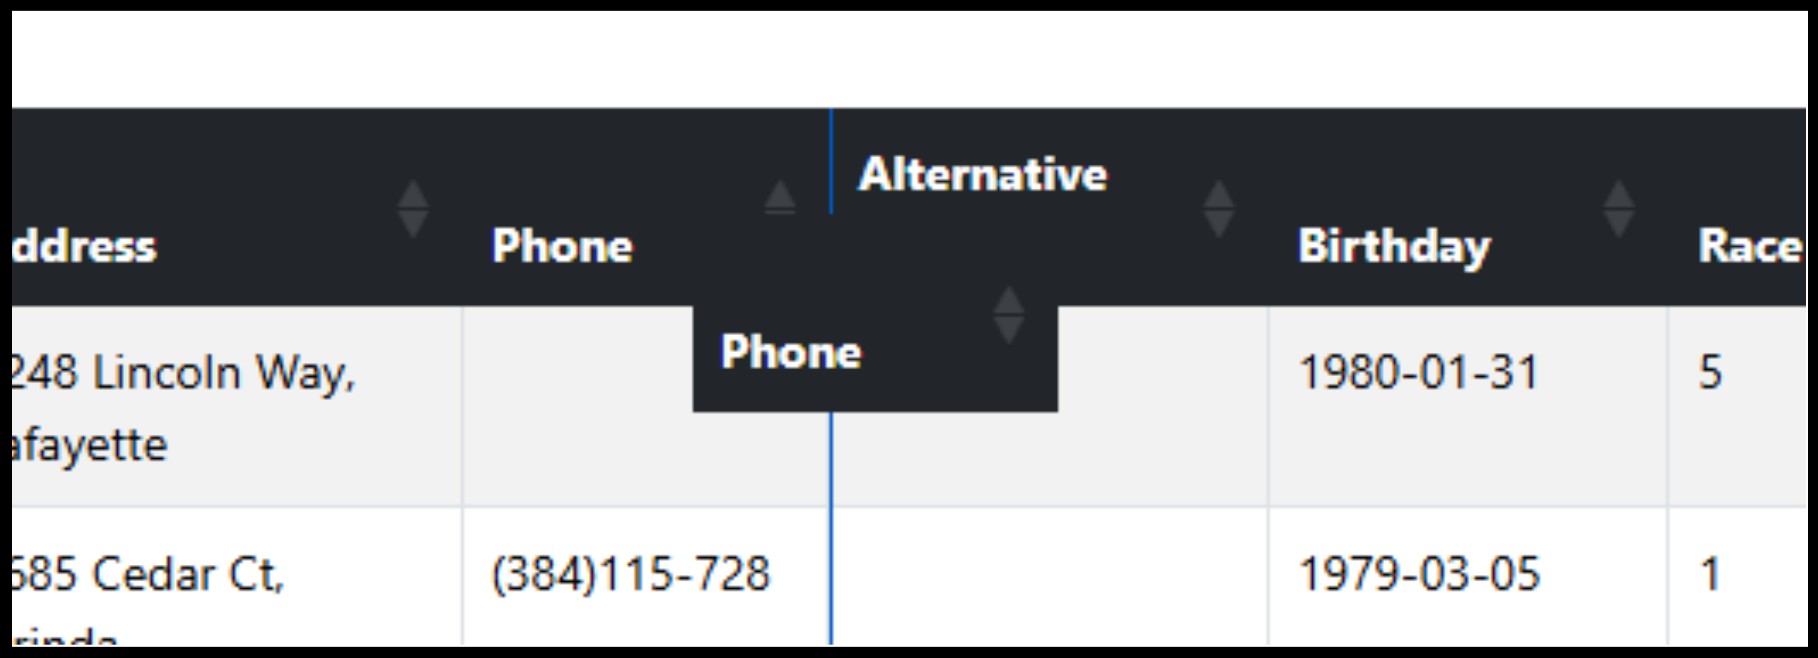
Column Reordering
You can rearrange the order in which the fields are displayed by clicking and dragging the field header to another position
Searching and Filtering
Towards the bottom of the table is the search function; Each column has its own search bar which filters all rows, multiple columns can be searched at the same time. For example, if there exists a Passenger named John who lives at 213 Example St, you can quickly narrow it down by searching John in Name, and 213 Example St in Address.

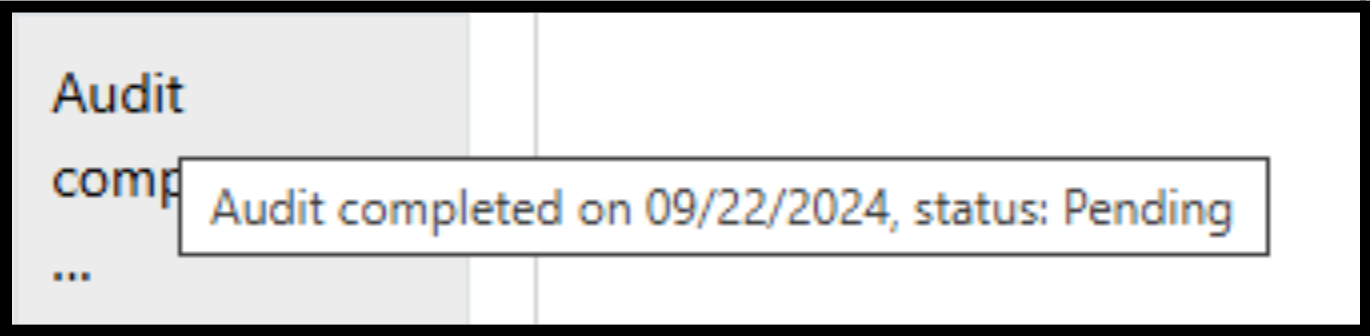
Sizing and text truncation
Some fields are truncated or cut to prevent their excessive length from bloating the table size, an indicator that a field has been truncated is “…”, and the full text can be seen by hovering over it with the cursor. If you still feel like the cells/rows are too small or big, you can use the default browser shortcuts (CTRL +/-) to adjust the table.