Report Generation
We pull data directly, such as ride counts and passenger details, from the database, and display them in tables and charts.
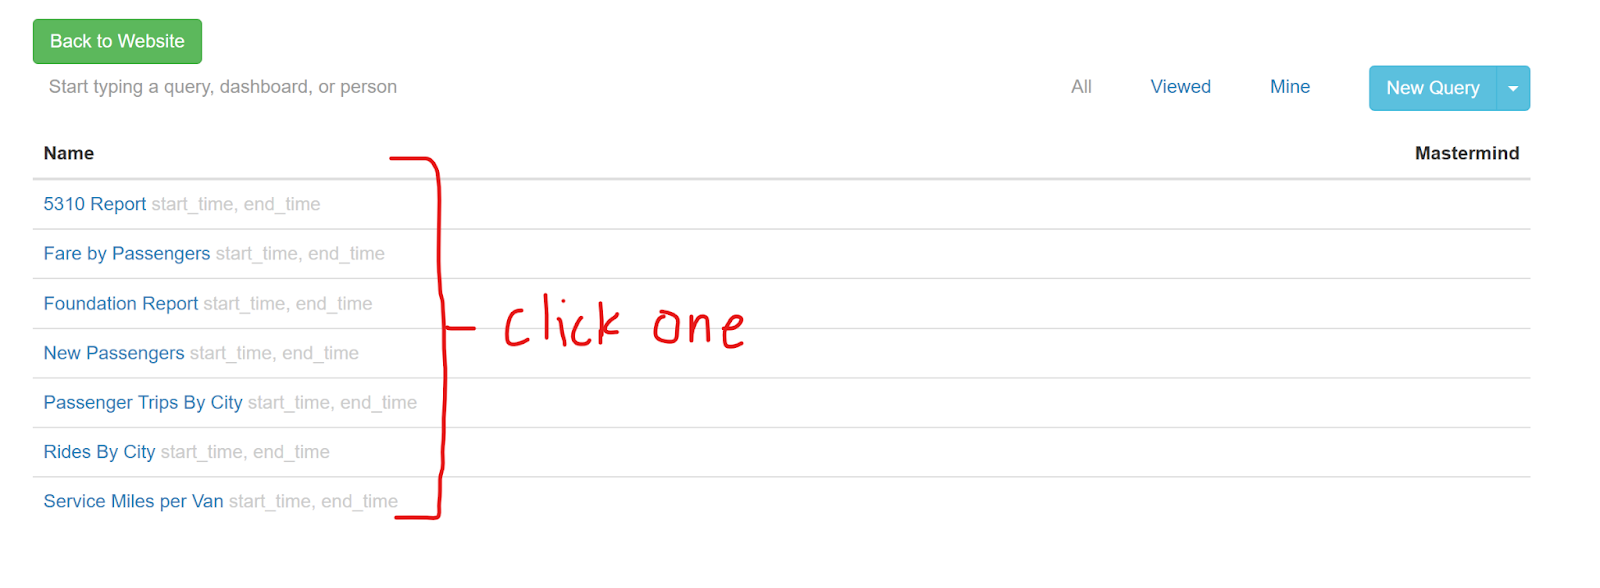
On the “Reports” tab:

-
Click on the selected query
-
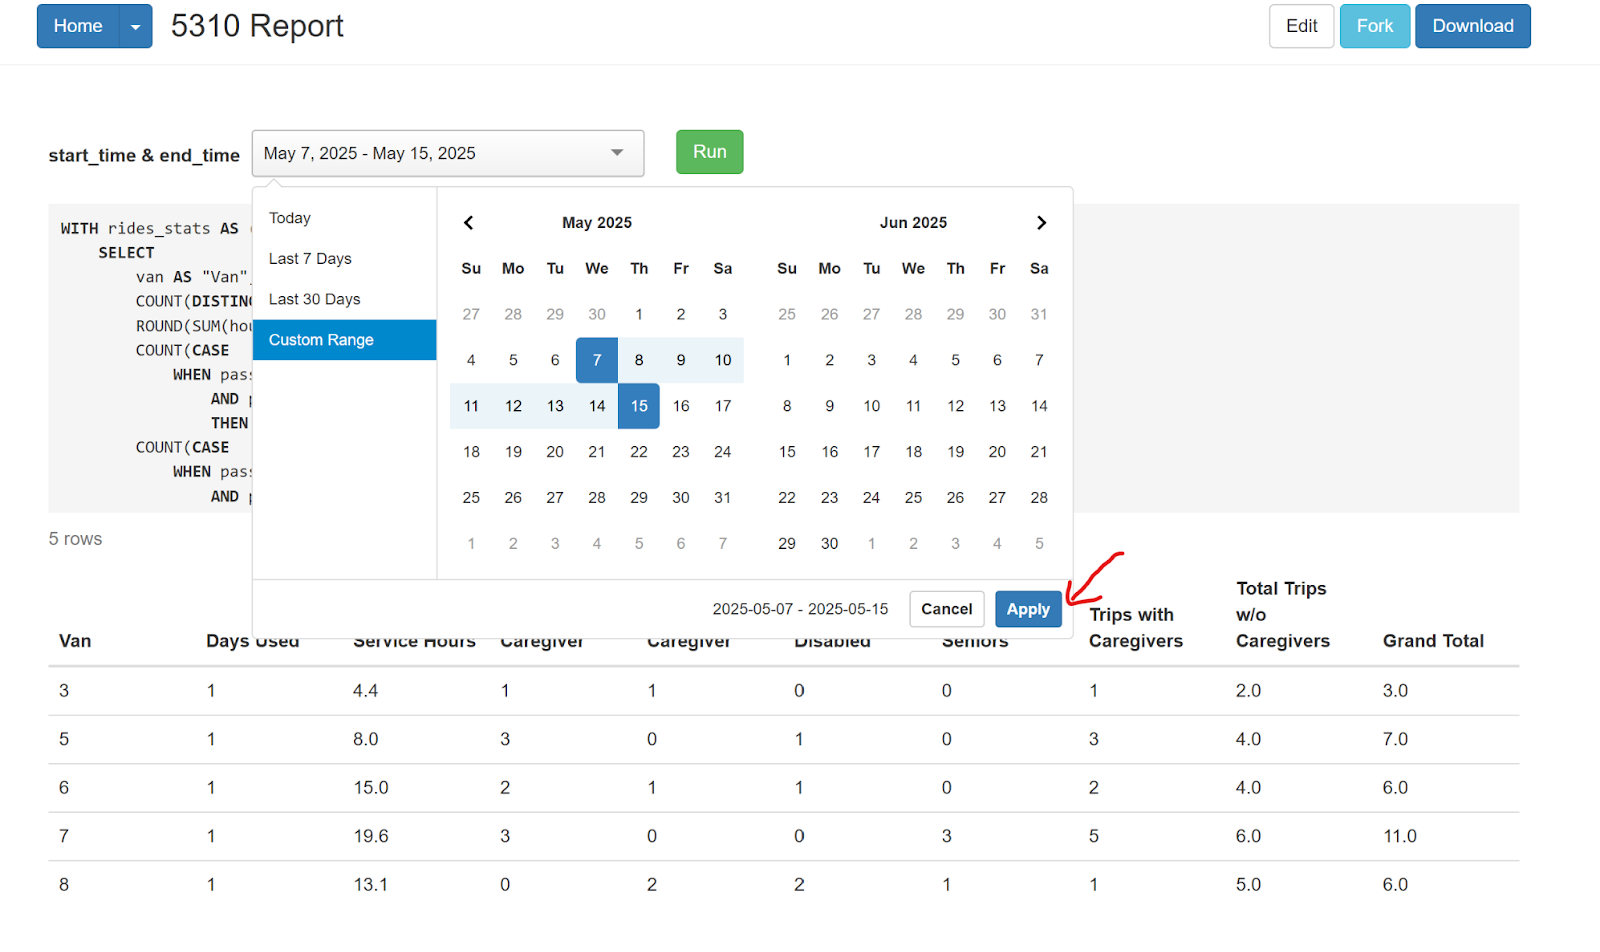
Choose the start date and end date, then click “Apply” to run the query
-
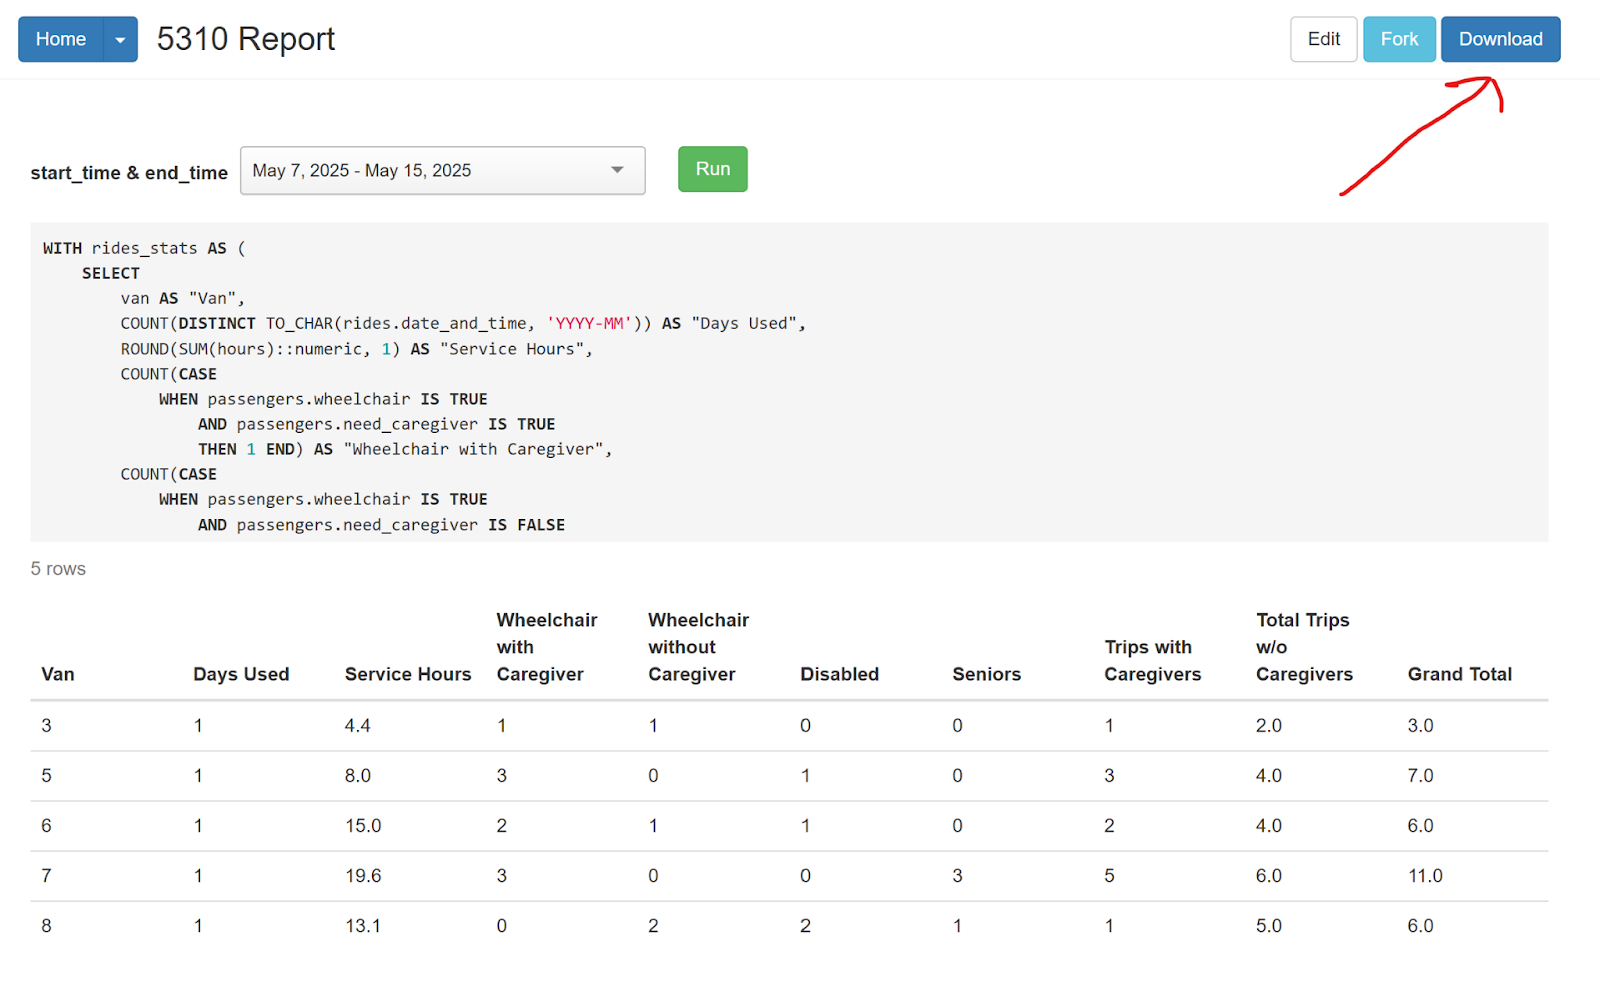
After the data appears, click on “Download” if needed, and it will download the report onto your device as a .csv file. You can then open that file in Microsoft Excel.
-
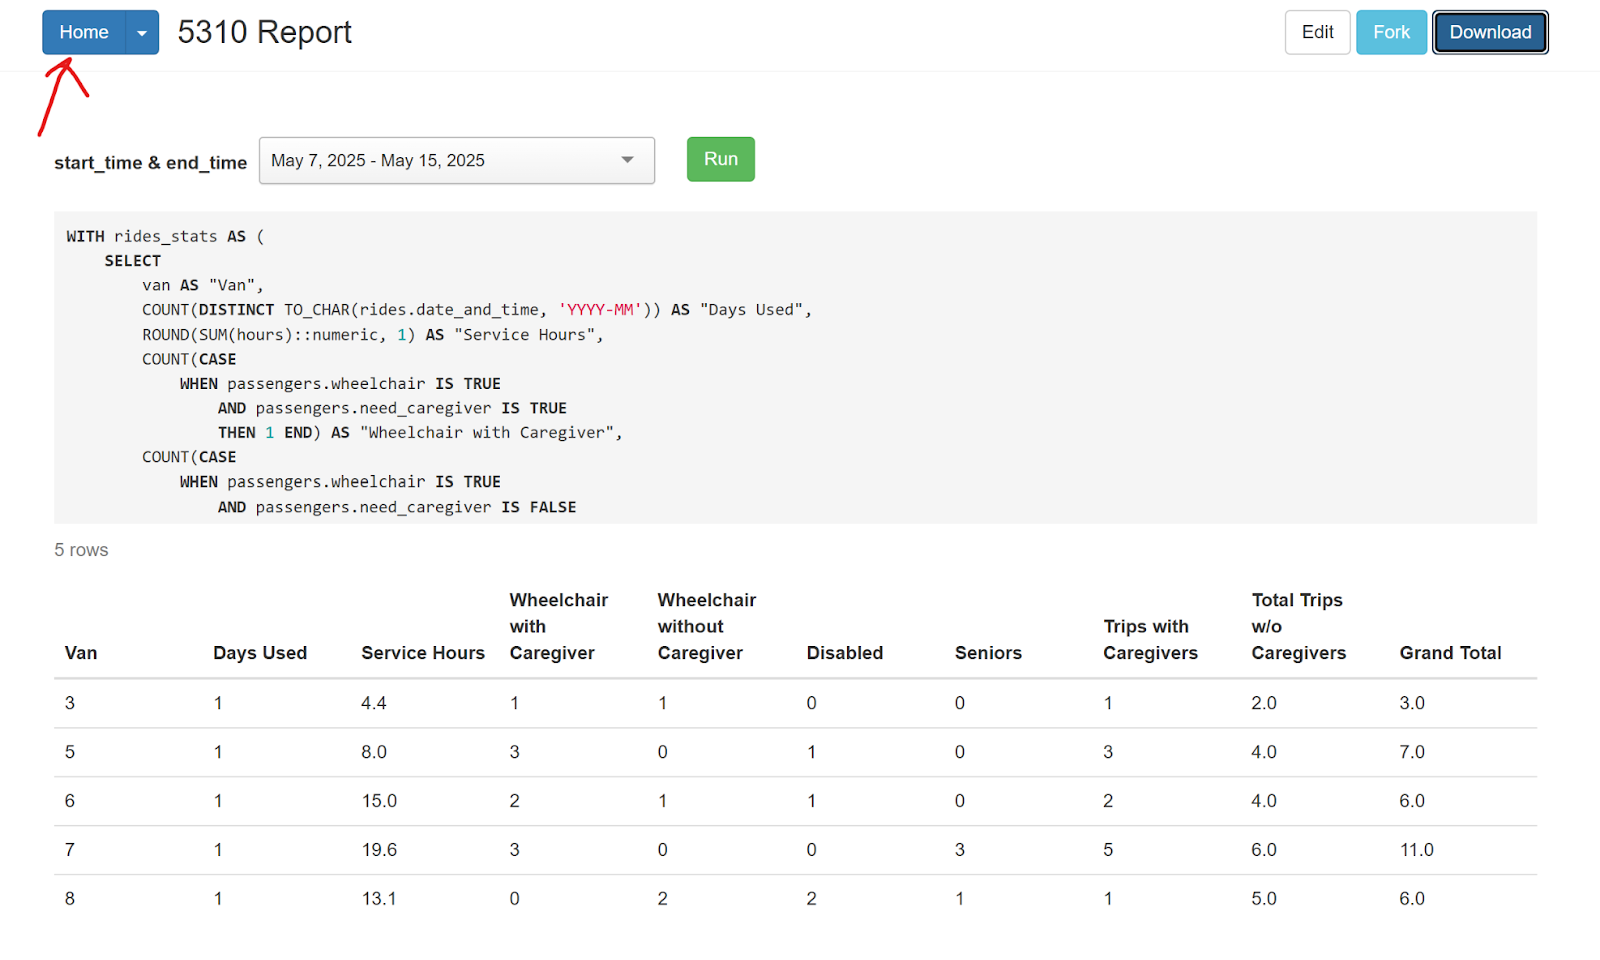
To go back to the list of data queries, click the “Home” button on the top left.
-
While in the Report Generation Home Page, click the “Back to Website” button to go back to the main app.
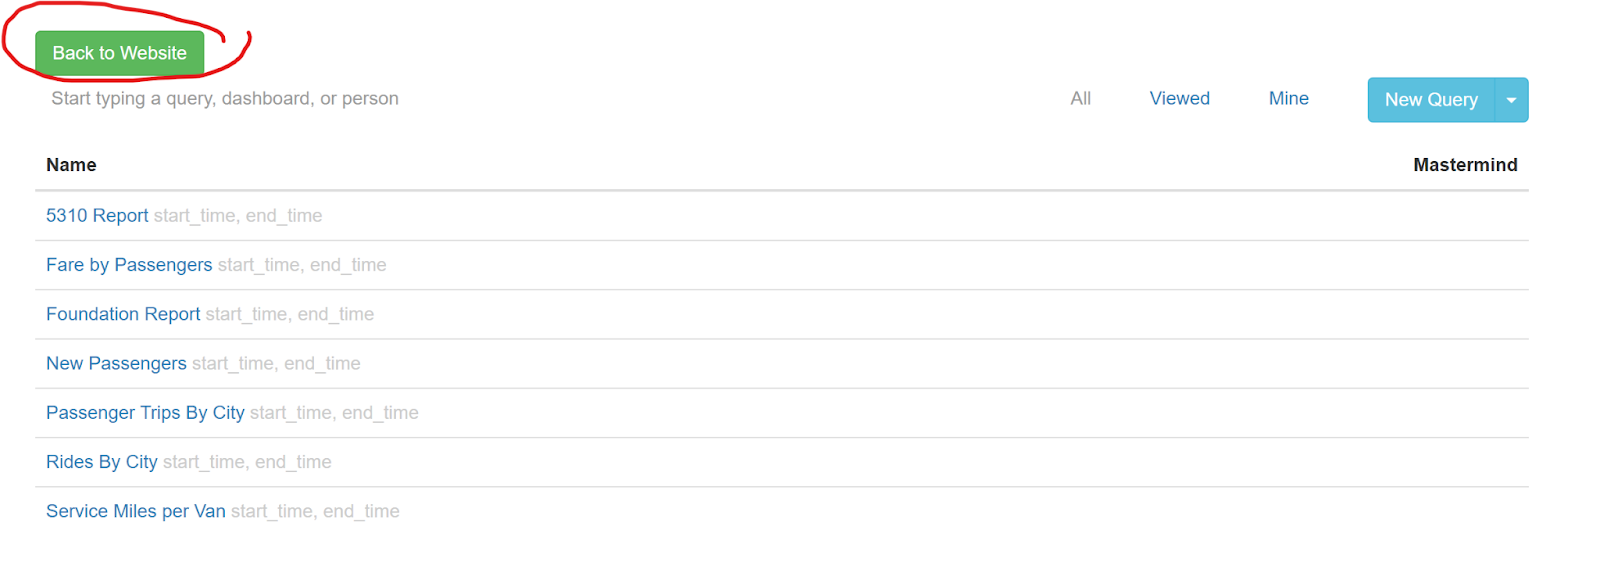
Data Queries
- 5310 Report: includes details like senior, disabled, and wheelchair passengers
- Fare by Passengers: shows how much fare passengers have paid over time
- Foundation Report: breakdown of count and proportion of low-income rides
- New Passengers: lists passengers who use the service for the first time
- Passenger Trips By City: counts how many trips a given passenger, grouped by their home city
- Rides By City: shows how many rides started or ended in a city
- Service Miles per Van (part of 5310 Report): adds up the miles each van drove during shifts